Renewable Energy
Based on non-survey data, the dashboard allows for tracking key metrics like energy output, carbon emissions avoided, grid contribution, and cost savings. The dashboard enables stakeholders to monitor sustainability goals, optimize energy production
To view the full-featured dashboard, please visit this page on a device with a screen width of 990px or more
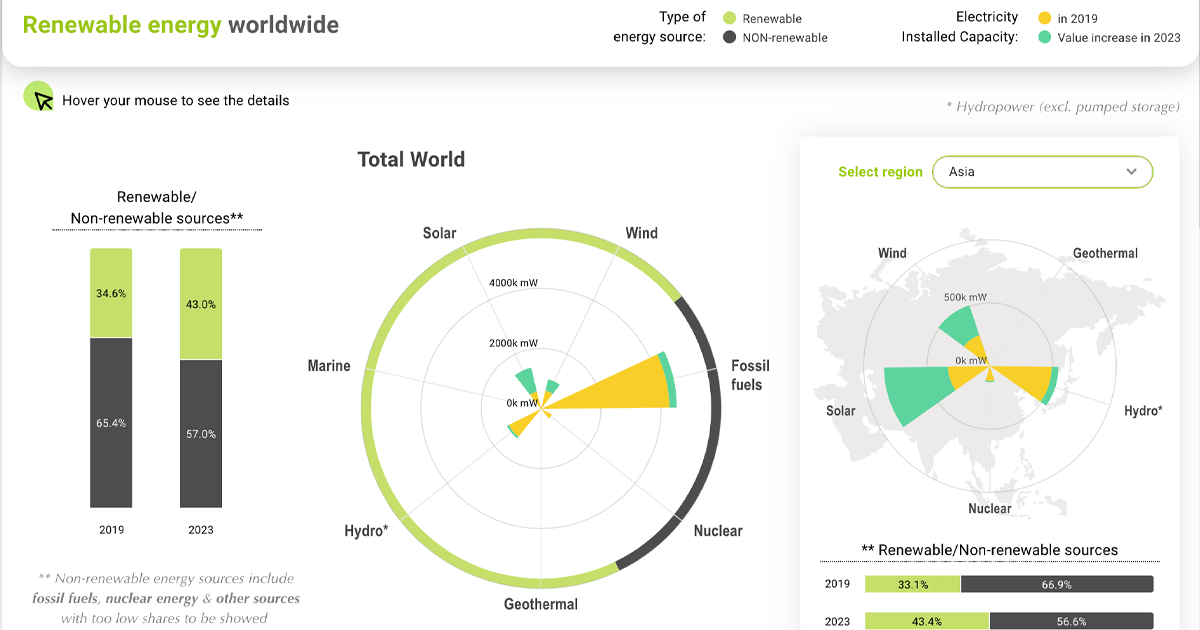

The dashboard shows global renewable energy usage statistics. This entry-level visualization solution showcases various chart types seamlessly embedded into websites, offering user-friendly data presentation without complex functionality. Featuring responsive design elements, mobile-optimized graphs, and lightweight widget integration, this dashboard demonstrates accessible data storytelling for businesses new to interactive reporting. Perfect for small to medium enterprises seeking cost-effective simple metric showcasing with minimal technical requirements. Ideal for companies beginning their digital transformation journey who need straightforward, plug-and-play visualization tools to enhance website content and broad audience communication.
Try DataTile for free
Isn’t it time you transformed your business? Try DataTile for free and see how it can enhance your productivity with it’s thorough analysis, interactivity and speed.
